

Status
RegisteredRegistry observedMangrove & blue carbonRegistered
MozBlue / Zambezi Delta Blue Carbon
The VCS 3142 filing defines a 5,116 ha first activity instance, a 60-year ex-ante carbon model, planting commitments and field protocols. Read the design figures against their exact filed scope and source page.
DigitizationStraatosHederaProject HubVerra Registry
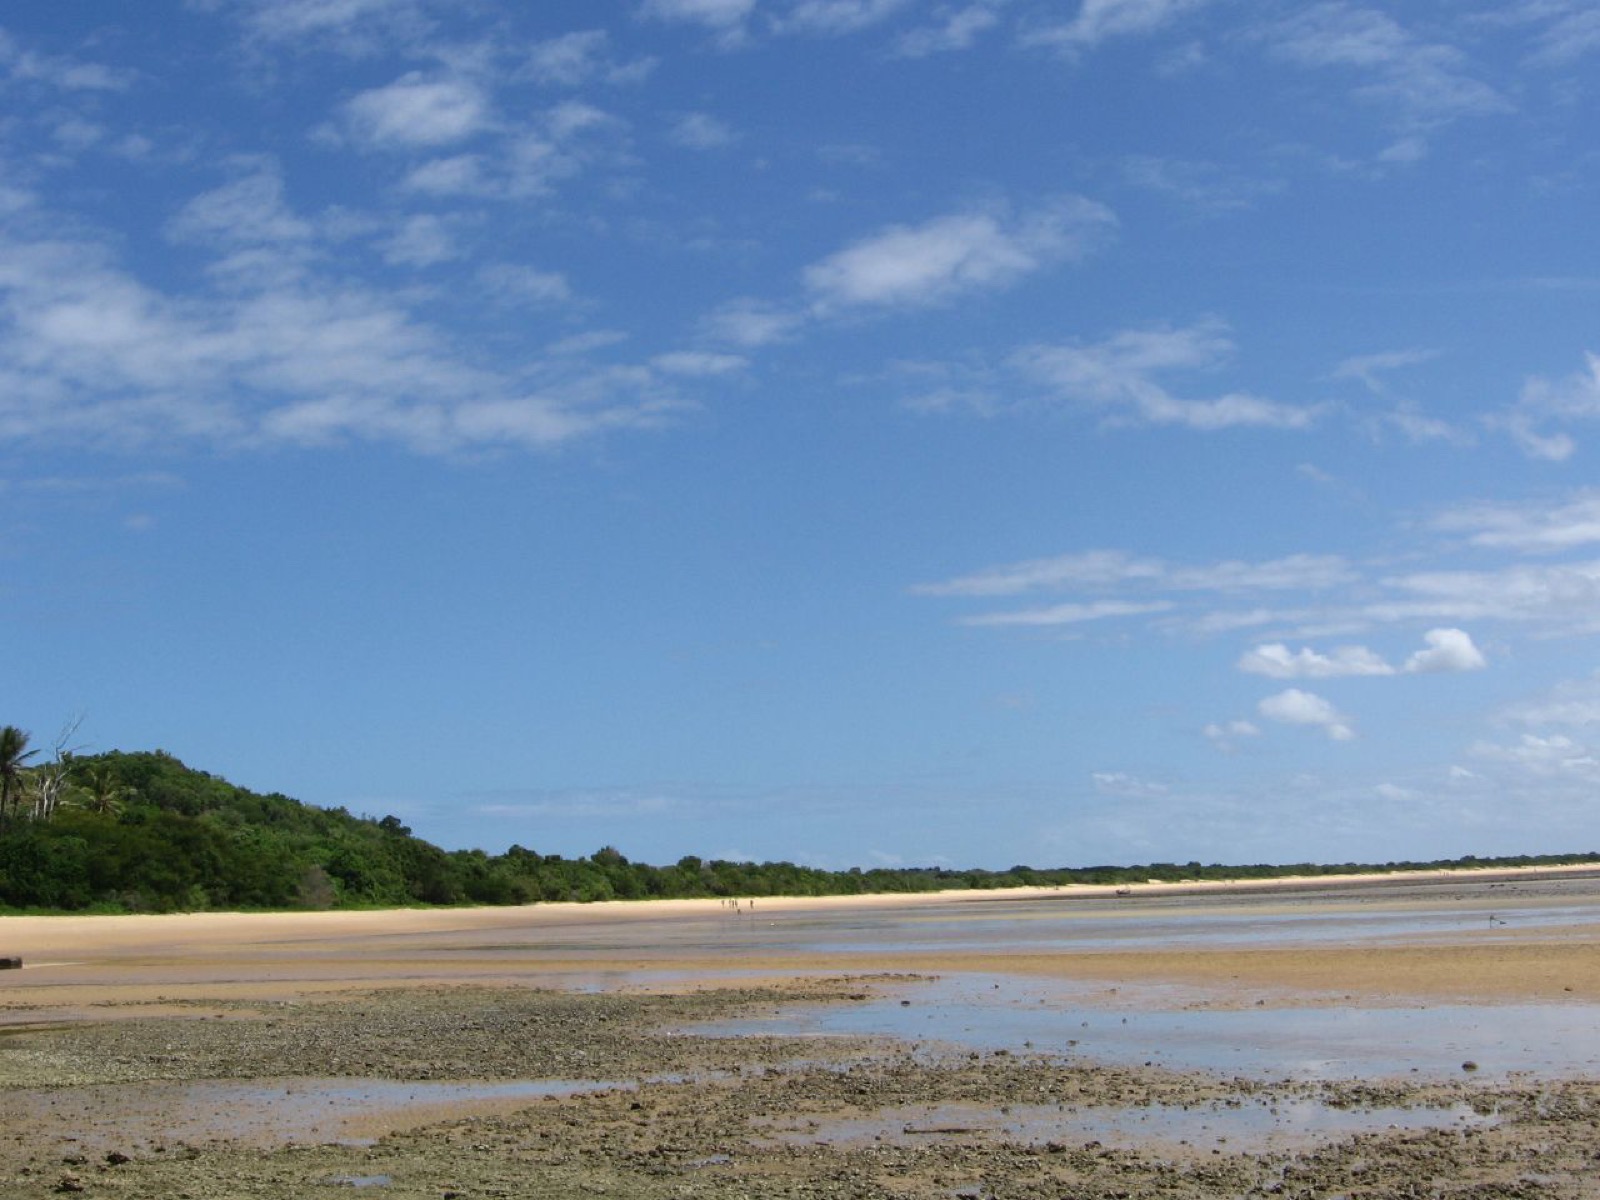
Image credit
Valentina Buj, CC BY-SA 2.0 via Wikimedia CommonsImage source ↗
Registered on
19 Jun 2026Registry observedPublic documents
12Registry observedRegistry area
155,000 haRegistry observedProject design
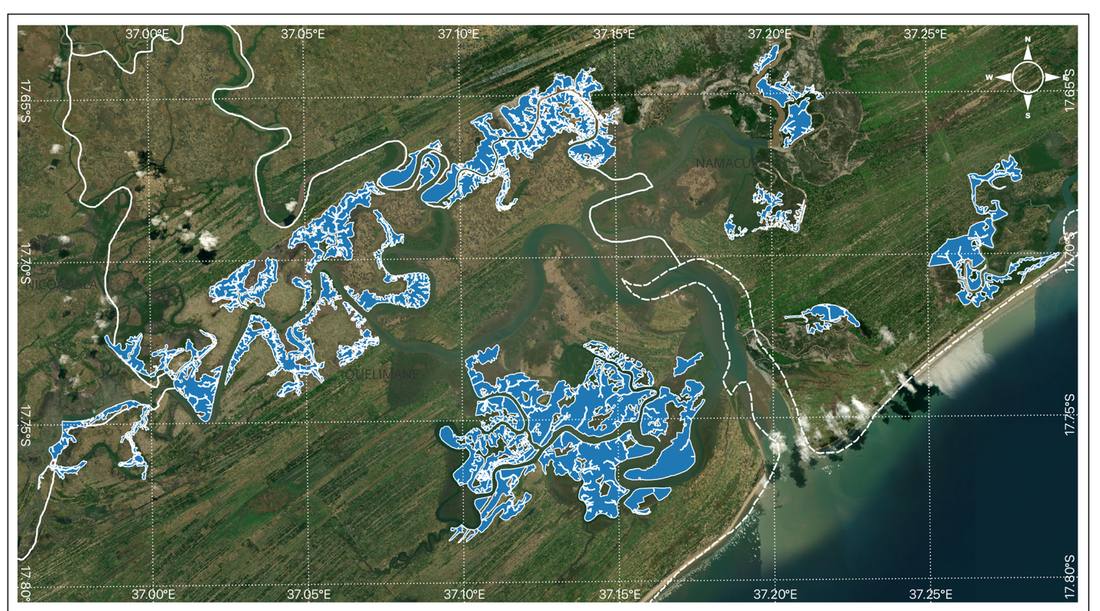
The first activity instance covers 5,116 ha in Quelimane and Namacurra.
Source and treatment
MozBlue VCS Project Description · physical p. 26 · Figure 5Bottom legend strip cropped because it carries the proponent logo; legend restated in caption.Public filing image · republication rights are not documented; source, page and treatment are shown for review.The registry area, grouped conservation scope, restoration target and MozBlue Project 1 have different definitions. The area comparison below keeps them distinct.
Planting establishmentCommitmentThree phases and density targets are filed; delivery actuals are absent.
Canopy & standDocumented baselineBaseline canopy is measured; post-planting canopy is not filed.
CarbonEx-ante modelThe 60-year schedule is a model, not issuance.
Pressure reliefCommitmentPatrol and livelihood mechanisms are stated; counts remain gaps.
Consent & tenureFiled progressConsent and licences are documented, with one denominator gap.
Independent reviewValidated / reviewedAENOR closed validation findings at reasonable assurance.
The filed map has its source beside it. This reading is independent of Verra and does not imply endorsement.
Project milestones
- Baseline carbon field campaign (Silvestrum, UEM)
- Validation kick-off meeting with AENOR
- Idugo Island water tower completed
- Validation desk review begins
- First complete VCS PD submitted to MTA
- REDD+ licence granted - Zambezia
- First round of validation findings
- Eden baseline field survey (Jul-Aug 2024)
- Groundbreaking ceremony
- Project start: planting begins, Idugo Island, 5 communities
- AENOR on-site visit (16-19 Dec)
Inspect project identity and crediting period
Project identity
Blue Forest Mozambique LDAFiled designProject identity
Grouped projectFiled designProject identity
VM0033 v2.1 · AFOLU WRC, ARR + RWEFiled designProject identity
15 Nov 2024 – 14 Nov 2084Filed designProject geography and imagery
Filed project geography, with source imagery and rights labelled separately.
Filed geography
MozBlue Project 1 filed geography
The Verra KML contains 48 polygons across 44 placemarks, measuring about 5,398.5 ha geodesically. This exceeds the 5,116 ha first activity area by about 282.5 ha, close to the PDD’s 283.5 ha adaptive buffer; the KML does not distinguish that buffer as a separate layer.
Loading filed geometry…
Drag to explore · pinch, scroll or use controls to zoom. Geometry is a filed proposal, not an observed restoration outcome.
Map credit
Geometry: Verra VCS 3142, MozBlue_Project1Instance.kml · Documents > Other, observed 24 Sep 2026.Verra source record ↗Basemap: OpenStreetMap contributors. Areas calculated geodesically from filed coordinates.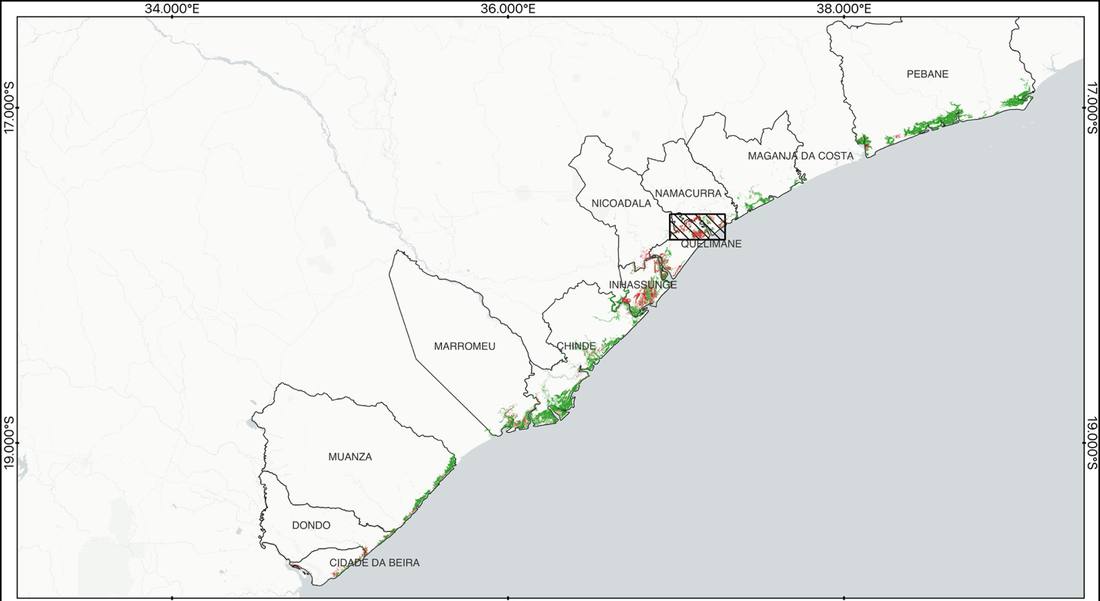
Enlarge image
Source and treatment
Bottom legend strip cropped because it carries the proponent logo; legend restated in caption.Public filing image · republication rights are not documented; source, page and treatment are shown for review.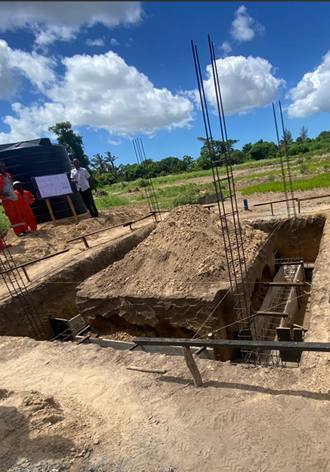
Enlarge image
Source and treatment
Left example image omitted; right edge cropped to exclude an identifiable person.Public filing image · republication rights are not documented; source, page and treatment are shown for review.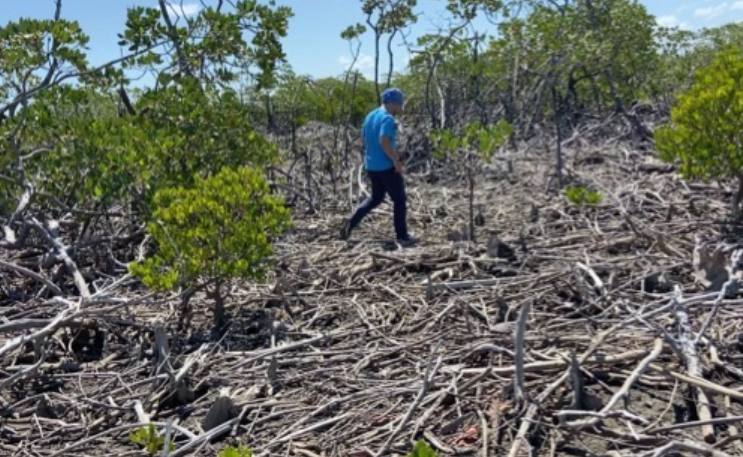
Enlarge image
Source and treatment
Uncropped.Public filing image · republication rights are not documented; source, page and treatment are shown for review.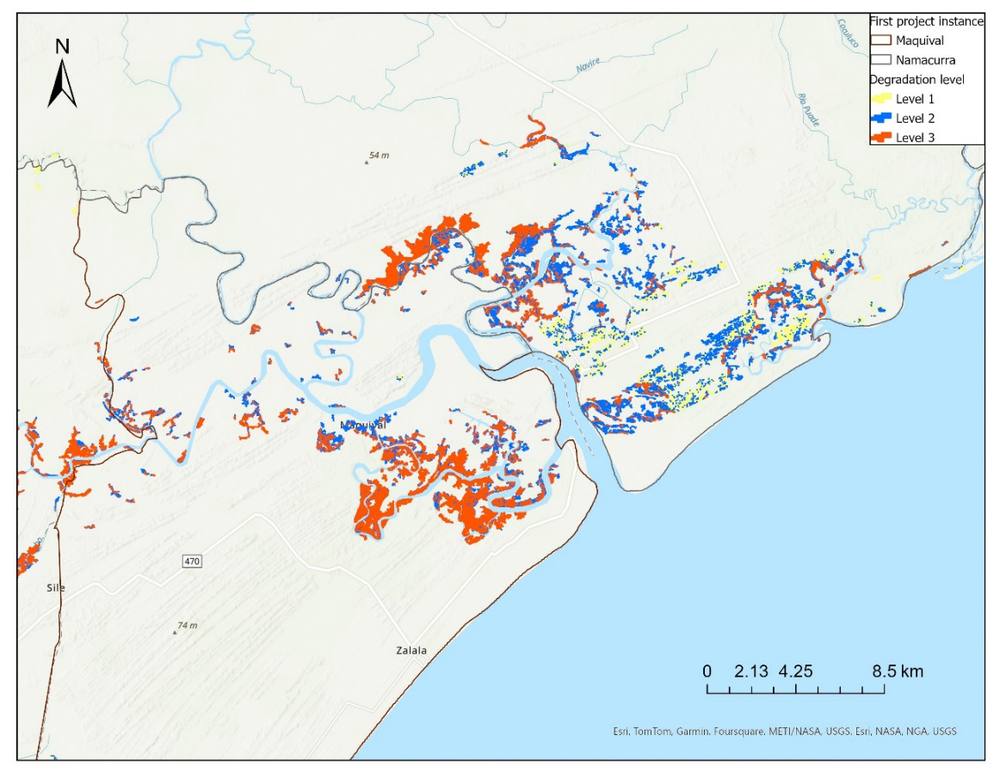
Enlarge image
Source and treatment
Uncropped.Basemap attribution visible in raster: Esri, TomTom, Garmin and contributing providers.Public filing image · republication rights are not documented; source, page and treatment are shown for review.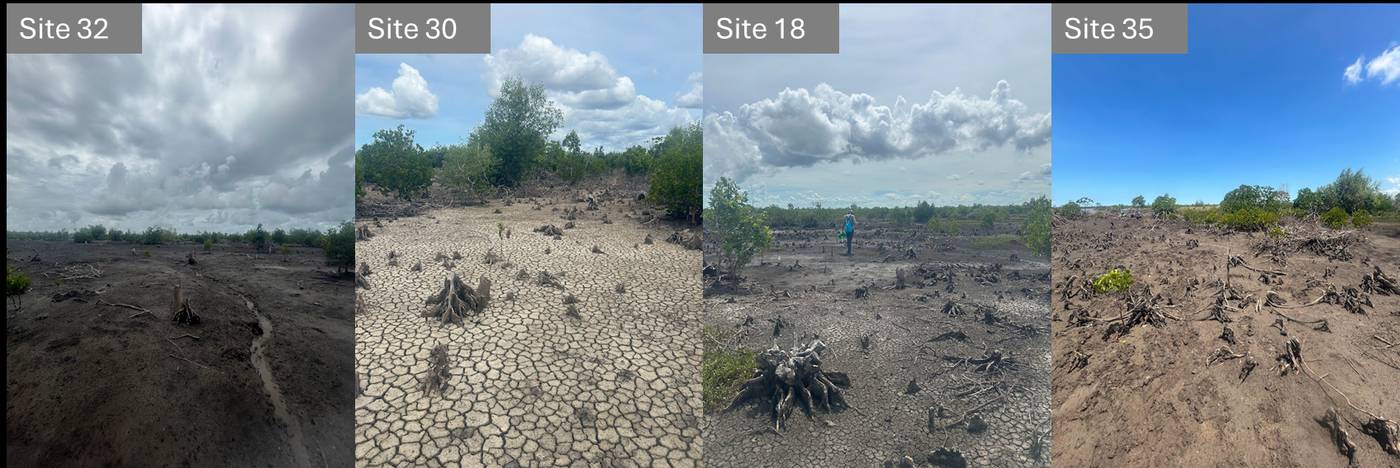
Enlarge image
Source and treatment
Uncropped.Public filing image · republication rights are not documented; source, page and treatment are shown for review.Carbon forecast
PDD model only. Select a year or switch to cumulative view.
Selected year2037
Gross model116,073 t
Buffer24,375 t
After buffer model91,698 t
Ex-ante model, not measured removals or issuance. The 60-year crediting period spans 61 calendar-year rows, including partial 2024 and 2084.
Open all 61 annual rows
| Year | Gross model | Buffer | After buffer model |
|---|---|---|---|
| 2024 | 0 | 0 | 0 |
| 2025 | 8,781 | 1,844 | 6,937 |
| 2026 | 24,996 | 5,249 | 19,747 |
| 2027 | 38,223 | 8,027 | 30,196 |
| 2028 | 40,463 | 8,497 | 31,966 |
| 2029 | 43,818 | 9,202 | 34,616 |
| 2030 | 42,541 | 8,934 | 33,607 |
| 2031 | 36,556 | 7,677 | 28,879 |
| 2032 | 31,109 | 6,533 | 24,576 |
| 2033 | 31,109 | 6,533 | 24,576 |
| 2034 | 31,109 | 6,533 | 24,576 |
| 2035 | 51,038 | 10,718 | 40,320 |
| 2036 | 87,841 | 18,447 | 69,394 |
| 2037 | 116,073 | 24,375 | 91,698 |
| 2038 | 116,073 | 24,375 | 91,698 |
| 2039 | 116,073 | 24,375 | 91,698 |
| 2040 | 109,465 | 22,988 | 86,477 |
| 2041 | 97,261 | 20,425 | 76,836 |
| 2042 | 87,898 | 18,459 | 69,440 |
| 2043 | 87,898 | 18,459 | 69,440 |
| 2044 | 87,898 | 18,459 | 69,440 |
| 2045 | 87,898 | 18,459 | 69,440 |
| 2046 | 87,898 | 18,459 | 69,440 |
| 2047 | 87,898 | 18,459 | 69,440 |
| 2048 | 87,898 | 18,459 | 69,440 |
| 2049 | 87,898 | 18,459 | 69,440 |
| 2050 | 87,898 | 18,459 | 69,440 |
| 2051 | 87,898 | 18,459 | 69,440 |
| 2052 | 87,898 | 18,459 | 69,440 |
| 2053 | 87,898 | 18,459 | 69,440 |
| 2054 | 87,898 | 18,459 | 69,440 |
| 2055 | 70,429 | 14,790 | 55,639 |
| 2056 | 38,168 | 8,015 | 30,153 |
| 2057 | 13,420 | 2,818 | 10,602 |
| 2058 | 13,420 | 2,818 | 10,602 |
| 2059 | 13,420 | 2,818 | 10,602 |
| 2060 | 13,420 | 2,818 | 10,602 |
| 2061 | 13,420 | 2,818 | 10,602 |
| 2062 | 13,420 | 2,818 | 10,602 |
| 2063 | 13,420 | 2,818 | 10,602 |
| 2064 | 13,420 | 2,818 | 10,602 |
| 2065 | 13,420 | 2,818 | 10,602 |
| 2066 | 13,420 | 2,818 | 10,602 |
| 2067 | 13,420 | 2,818 | 10,602 |
| 2068 | 13,420 | 2,818 | 10,602 |
| 2069 | 13,420 | 2,818 | 10,602 |
| 2070 | 13,420 | 2,818 | 10,602 |
| 2071 | 13,420 | 2,818 | 10,602 |
| 2072 | 13,420 | 2,818 | 10,602 |
| 2073 | 13,420 | 2,818 | 10,602 |
| 2074 | 13,420 | 2,818 | 10,602 |
| 2075 | 13,420 | 2,818 | 10,602 |
| 2076 | 13,420 | 2,818 | 10,602 |
| 2077 | 13,420 | 2,818 | 10,602 |
| 2078 | 13,420 | 2,818 | 10,602 |
| 2079 | 13,420 | 2,818 | 10,602 |
| 2080 | 13,420 | 2,818 | 10,602 |
| 2081 | 13,420 | 2,818 | 10,602 |
| 2082 | 13,420 | 2,818 | 10,602 |
| 2083 | 13,420 | 2,818 | 10,602 |
| 2084 | 13,420 | 2,818 | 10,602 |
Source and totals
PDD pp.15-19 Table 1 (60 rows, read in full); PDD pp.164-167 Table 25 (60 rows, read in full). Annual rows sum to 2,649,560 gross and 2,093,165 after buffer. The PDD separately states 2,649,564 gross and 2,093,155 after buffer. These small differences are retained. “Available” is the PDD model label, not evidence of issued credits.
Gross modelled removals
2,649,564 tCO₂eEx-ante modelModelled annual average
44,159 tCO₂e/yrEx-ante modelNon-permanence buffer
556,408 tCO₂eEx-ante modelExpected benefit to date
0 tCO₂eFiled progressRestoration and biodiversity
Area definitions, planting phases and target species from the PDD.
Filed activity design
5,116 haProject 1 planting phases
5,116 ha planned across three phases; phase area is a target, not measured planting.
20241,200
20252,216
20261,700
Basis: MozBlue Project 1 planting plan (5,116 ha)
Planting density
5,000–10,000 stems/ha8,000 stems/ha working target
CommitmentNative species
4Filed planting mix; see source records for species
Filed designTarget species mix
Filed planting-share ranges. These are ranges, not measured composition or four exact parts of a whole.
Rhizophora mucronata
35–45%
Avicennia marina
20–25%
Ceriops tagal
15–25%
Bruguiera gymnorhiza
5–10%
Share of planned planting mix · Filed design
Five area definitions
Common scale: 305,400 haBar lengths compare size. These figures describe different boundaries and purposes; they are not all nested.
National mangrove estateContext estimate
305,400 ha
Registry project areaRegistry field
155,000 ha
Grouped mangroves conservedApproximate PDD scope
154,000 ha
Grouped restoration targetPDD target
29,387 ha
MozBlue Project 1 activityFirst instance
5,116 ha
Inspect area definitions
The registry's 155,000 ha area and the PDD's approximate 154,000 ha conserved scope remain distinct. The 29,387 ha restoration target is grouped; the 5,116 ha figure refers to MozBlue Project 1 in Quelimane and Namacurra.
Inspect area records, species ranges and phase citations
Registry project area
155,000 haRegistry observedGrouped scope: mangroves conserved
154,000 haFiled designGrouped restoration target
29,387 haFiled designProject 1 activity instance
5,116 haFiled designPlanting phases
Phase 1 · 2024
1,200 haCommitmentPhase 2 · 2025
2,216 haCommitmentPhase 3 · 2026
1,700 haCommitmentFiled species design
Rhizophora mucronata
35–45%CommitmentAvicennia marina
20–25%CommitmentCeriops tagal
15–25%CommitmentBruguiera gymnorhiza
5–10%CommitmentPlanting density
5,000–10,000 stems/ha; 8,000 targetCommitmentLand and community benefits
The filed allocation is a model. Consent and tenure progress are reported separately.
37%
Communities
60% of EBITDA = 37% of revenues; social programs - woodlots, cookstoves, alternative livelihoods
Filed model of revenue allocation, not payments. The PDD describes 59% as staying in Mozambique.
Consent and land rights
12 source claimsCounts describe the record, not project performance
2 Filed design / proponent claim6 Filed progress4 Commitment
State ownership
Mozambique owns land, natural resources and carbon.
Filed design / proponent claimREDD+ licences
Zambezia granted July 2024; Sofala granted April 2025.
Filed progressCommunity tenure
Community Land Associations hold delimited DUATs.
Filed design / proponent claimGuardianship agreement
Sixty-year MGA required before planting in a community.
CommitmentShow 8 more source claims
Consultation window
February–July 2023 across eleven districts and four stages.
Filed progressZambezia consent
252 of 252 communities
Filed progressSofala consent
35 signed FPICs
Filed progressProject 1 delimitation
41 of 67 communities filed as delimited; 26 in Namacurra remained.
Filed progressRevenue share
37% of revenues allocated to communities in the filed model.
CommitmentWater tower
10,000 L tank; stated 15,000 L/day supply for roughly 8,000 residents; reported complete April 2024.
Filed progressWoodlots
Bamboo and eucalyptus alternatives to mangrove timber.
CommitmentCookstoves and livelihoods
Improved stoves, milling, salt, agriculture, husbandry and fishing support.
CommitmentValidation and monitoring
Filed measurement design
Carbon sampling plots
Carbon plot7 m radiusAll stems measured; stratified random placement
Survival baseline
Within 2 daysAfter planting
Filed designSurvival follow-up
Every 6 monthsBi-monthly reporting in filed plan
CommitmentAnti-cutting patrols
≥2 per weekMonthly reports planned
CommitmentValidation findings are closed in the cited validation report. Post-planting survival and biomass actuals were not established in the documents read.
Canopy in the carbon model
The baseline observation and later modelling assumptions have different evidential weight.
Baseline measured1.9%measured, pre-existing trees
Year 3 assumption15%assumed (Silvestrum expert opinion) - SOC accrual begins
Year 6 assumption50%assumed - full default SOC rate applies
Seedling survival
The plan sets an 80% target and calls for adaptive measures below 70%.
70%
intervene below80%
target
Measured survival: not reported in the documents readintervene below80%
target
23 findings11 clarifications + 12 corrective actionsAll closed in the validation record
5% materialityReasonable assuranceVCS Standard v4.7
16–19 Dec 2024Field visitApproximately 44 named interviewees
How the plan is meant to work
Starts withCharcoal, timber and cyclone pressure
→Project responseFPIC, tenure and 60-year guardianship
9 source claimsCounts describe the record, not project performance
4 Validated / reviewed2 Filed design / proponent claim2 Commitment1 Open gap / source conflict
Opinion
Reasonable level of assurance; compliance with VCS Standard v4.7.
Validated / reviewedMateriality
5%
Validated / reviewedFindings
11 clarification requests and 12 corrective action requests, closed.
Validated / reviewedSite work
16–19 December 2024; approximately 44 named interviewees.
Validated / reviewedShow 5 more source claims
Survival baseline
Within two days of planting
Filed design / proponent claimSurvival follow-up
Every six months; bi-monthly reporting
CommitmentAnti-cutting patrols
At least twice weekly; monthly reports
CommitmentCarbon plots
7 m radius, stratified random; all stems measured
Filed design / proponent claimFiled actuals
No post-planting survival, canopy, biomass or hectares-planted actuals in the documents read.
Open gap / source conflictSustainable development goals
Ten goals claimed in the filing; select one to inspect its proposed indicator.
10 / 17 goals namedFiled contribution claims · select a goal for its proposed measure
13
Climate Action
Removal of an estimated 2,649,564 tCO2e over 60 years (the matrix row itself prints 2,649,654)
- Proposed indicator
- Total projected CO2 removed over project lifetime
SDG icon credit
Icons: United Nations Sustainable Development Goals. The content of this publication has not been approved by the United Nations and does not reflect the views of the United Nations or its officials or Member States.
Evidence coverage
Select a domain and indicator to compare its baseline, plan and filed progress.
IndicatorBaselineProject planReported
Area planted
Filed design reference: 5,116 ha (Project 1)
Baseline
0 ha at the 15-Nov-2024 start
Project plan
5,116 ha in three phases by Dec 2026
Reported
no hectares-planted figure in the filed set (planting commenced Nov 2024)
Cells show whether this filing contains a figure or statement for each stage. They do not grade ecological recovery. “No figure” can include a narrative note; select a row to inspect its exact text.
Evidence gaps
9 source claimsCounts describe the record, not project performance
9 Open gap / source conflict
Project 1 buffer
636 ha and 283.5 ha both appear on PDD p.9; maps and Annex 3 use 283.5 ha.
Open gap / source conflictGross removals total
PDD states 2,649,564 tCO2e; annual rows sum to 2,649,560; SDG 13 row prints 2,649,654.
Open gap / source conflictAvailable-after-buffer total
Table 25 states 2,093,155; its annual rows sum to 2,093,165, with thirteen one-tonne plateau mismatches.
Open gap / source conflictAnnex 3 ARR area arithmetic
5,416 ha is footnoted as 5,116 + 283.5 ha, a 16.5 ha difference.
Open gap / source conflictShow 5 more source claims
Ecological actuals
No post-planting hectares, stems, survival, canopy or biomass measurement in the 280-page PDD.
Open gap / source conflictIssued or verified VCUs
None established by this set; the PDD says expected benefit to date is 0.
Open gap / source conflictMGA and programme counts
Signed MGAs, jobs, cookstoves and livelihood units are named as indicators but not counted.
Open gap / source conflictSofala FPIC denominator
35 signed FPICs are filed without a total community count.
Open gap / source conflictRisk decomposition
The 21% rating is filed; numeric internal, external and natural-risk subtotals are not in the notes export read.
Open gap / source conflictSources and reading boundary
3 source documentsVCS Project Description · MozBlue · VCS 3142
Inspect source documents and reading boundary
- VCS Project Description · MozBlue · VCS 3142
v1.0 · 8 Jun 2026 · 280 pages · Read: 1–27, 33–58, 84–88, 100–115, 126–224, 236–248, 252–256, 268–280; plus whole-document keyword search.
- VCS Validation Report · Project 3142
v1.3 · 8 Jun 2026 · 295 pages · Read: 1–12.
- Non-Permanence Risk Report notes · Project 3142
19 Jun 2026 notes export · 21 pages · Read: 1–21.
Documents not read for this profile
Registration Review Report, ERR calculation spreadsheet, Validation Representation, monitoring reports and issuance records were outside the supplied reading set. Their absence is not treated as evidence that they do not exist.
Return to the project overview · Open the Verra register foundation